Piktochart: Your Infographic & Visual Design Powerhouse
Piktochart is a platform that lets you create professional-looking infographics, flyers, posters, reports, and videos with drag and drop tools and AI-powered features. You can also integrate Piktochart into your workflow, download your visuals, and access premium templates and insights.
Why Piktochart
Piktochart is designed to make visual content creation easy and fast for anyone, regardless of their design skills or experience. Here are some of the benefits of using Piktochart:
- Simplicity: You can learn the platform in less than an hour and start creating your visuals in minutes. No need to master Photoshop, Illustrator, or other complicated software.
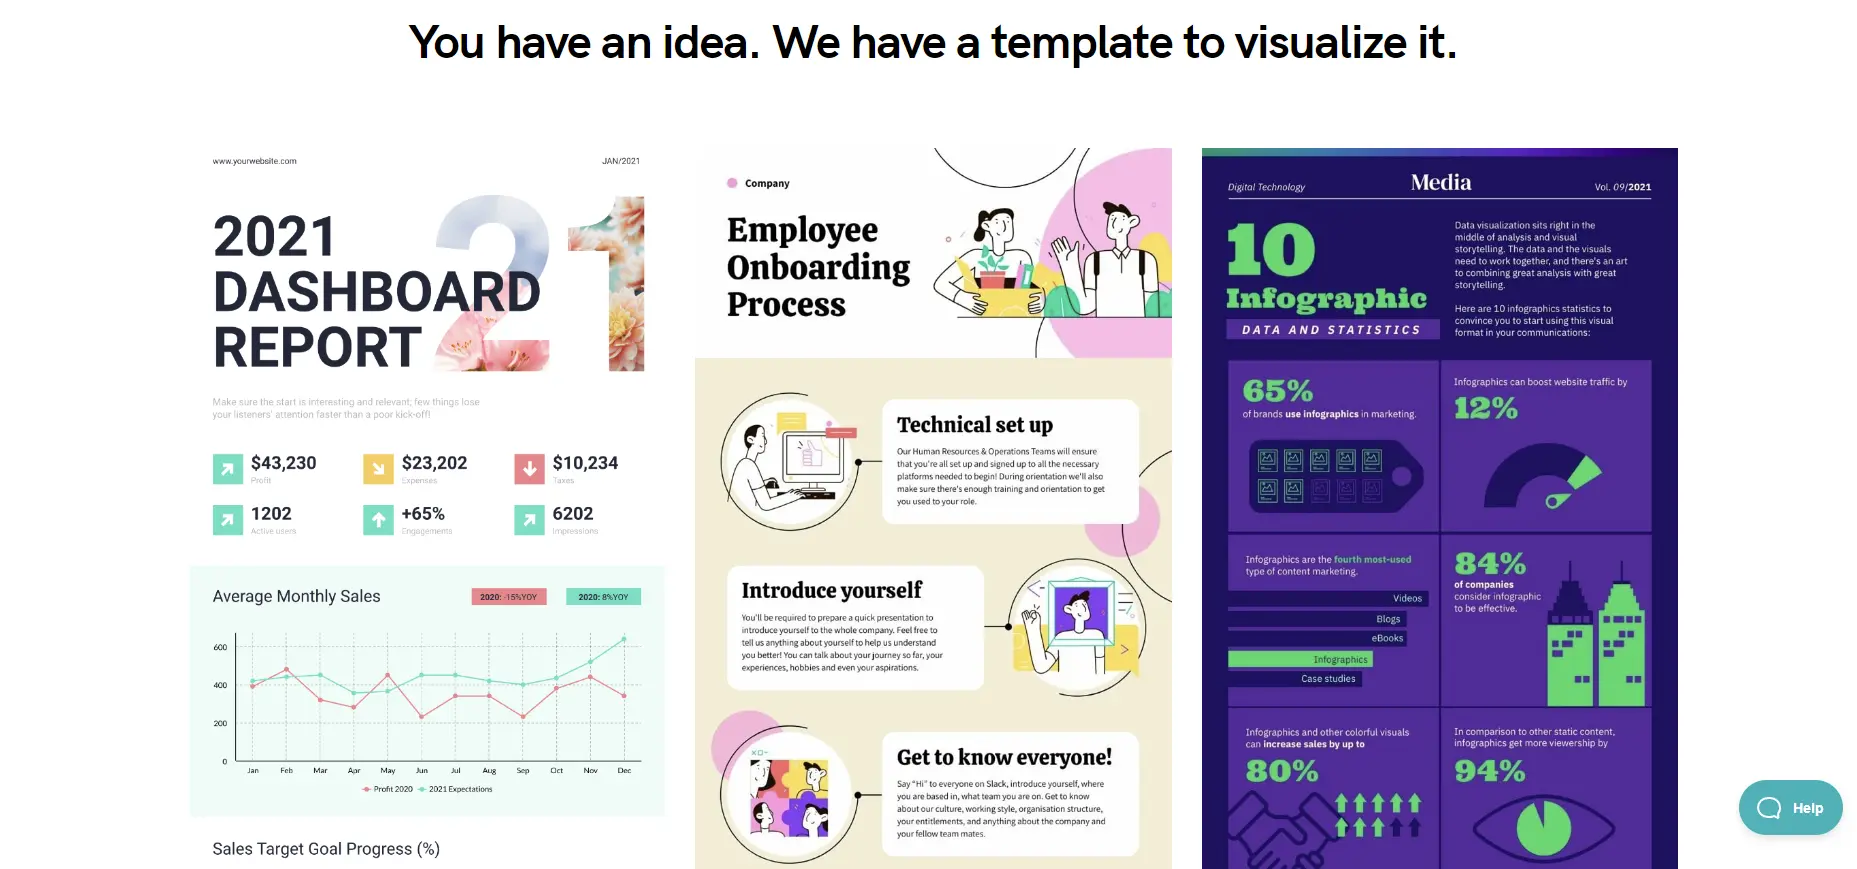
- Variety: You can choose from hundreds of templates for different types of visuals, such as infographics, reports, presentations, flyers, posters, and videos. You can also customize them to suit your brand, style, and purpose.
- Data Visualization: You can turn complex data into clear and catchy visuals using charts, graphs, and interactive maps. You can easily import your data from CSV, Excel, or Google Sheets, or copy-paste it into the graph maker.
- Video Editing: You can edit your videos like a text document using Piktochart Video. You can automatically transcribe, add subtitles, and crop video to optimize for different social media channels. All in a matter of minutes.
- Integration: You can download your visuals in PNG, PDF, or PPT formats and share them with your colleagues, clients, or audience via email or social media. You can also embed them on your website or blog.
Use Cases and Applications
- AI Infographic Maker: This feature allows you to create an infographic in seconds, based on your text input. You just need to type or paste your text, and the AI will generate a relevant and attractive infographic for you. You can also edit and customize it further.
- Piktochart Video: This feature allows you to edit your videos like a text document, without any hassle. You can upload your video, and the AI will transcribe it and add subtitles automatically. You can also crop your video to fit different social media platforms, such as YouTube, Facebook, Instagram, or LinkedIn.
- Piktochart Insights: This feature allows you to access premium templates and insights from experts and industry leaders. You can learn from their best practices, tips, and tricks, and apply them to your own visuals.
- Create presentations: Piktochart can be used to create professional-looking presentations for business or school. This can be helpful for pitching ideas to investors, clients, or stakeholders, or for teaching a lesson.
- Design reports: Piktochart can be used to create reports that turn boring data into a clear story. This can be helpful for communicating complex information to managers or team members.
- Make posters: Piktochart can be used to create eye-catching posters to promote events, announce news, or simply share information.
- Create social media videos: Piktochart can be used to create engaging social media videos from webinars, Zoom recordings, and thought leadership videos. This can be helpful for driving engagement on social media platforms.


